
As usual at the beginning of each year it is the time to gather all the analytics of your DAM system with figures and metrics in order to find some arguments to your organisation of the DAM usage and to measure the performance of your marketing campaigns. When budget time rolls around, many organizations find themselves asking the same question: “what are we going to do about our data?”. Organizing scattered and large data sets is one of the top business challenges that companies have to face.
To get the best return of investment (ROI) you need business measurement tools like key performance indicators (KPI) or even better business intelligence (B.I). Without the addition of these methods, it will be a challenge to retrieve the best information from your DAM system. With the right analytics, you’ll be able to give figures that the budget holders of the company understand.
What are KPIs and B.I? Why are they important for a DAM system ?
KPIs are measurement tools that can be set for your own assets and the projects they are involved. The metrics are the expression of a scope critical for the project or even the business as a whole. KPIs are always custom for every customer. But not all DAM systems can achieve and deliver the right KPIs. Most of them are just providing basic KPIs which are only activity report like :
- DAM usage who and when users login
- The best assets
- The activity report
- The bandwidth and monitoring
- The browsing activity
Example of such report by Wedia :
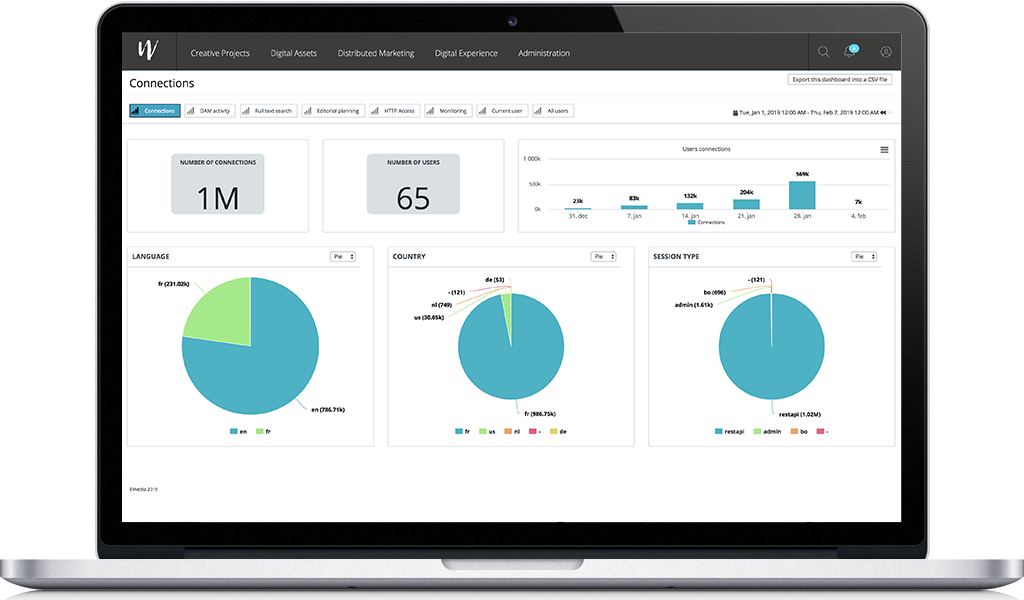
These informations are important for the global activity report of your DAM but not so releavant to measure the performance of your assets involved in projects. Espcially to improve the DAM adoption and maximize the ROI every stockholder needs to keep track of performance otherwise it can be nebulous. I had this experience so many times with customers, especially in large organisations where DAM systems have to compete with other systems. In the scope of adapting to new technologies it can be quickly frustrating and risks without the tools to measure and ensure user adoption.
Building KPIs for DAM:
To build the right list of KPIs for your DAM, you need to select the metrics that best align with your customers goals. It’s important to choose the right KPIs to ensure that you can show measurable improvement. It is a team work between you and the customers. At that stage it is important during the RFP to select the right DAM. As I said we are more and more talking about B.I for business intelligence in order to achieve your goals. A business intelligence dashboard example for marketing departments or agencies: Monitor leads through marketing campaigns, landing pages and conversion rates with meaningful reports, graphs, and maps that are centralized in one dashboard. Measure the overall performance as well as average costs and important KPIs to understand the impact of your marketing and sales efforts so you can make the best business decisions possible.
In a DAM system you can set your own metadata set to layout your own custom metadata at of the top of your collections or projects. B.I tools will be able to build relationships between the metadata of your assets and the metadata of your projects alongside your business workflow. I'm talking about real business engine with custom milestones of approval cycles and not basic custom metadata where you can approve or reject an asset which are often used in DAM systems.
Example of B.I dashboard by Sisense :
Metadata audits:
This step is really required to give you insights of what is wrong or which metadata set or format you need to track. Start by uploading assets, performing search to validate the right strategy. It is important to understand all the workflow that can starts from your ERP system and which communication channels you have to manage for the distribution (CMS, Social…) to look relationships between metadata attributes. All this work may require some modifying the metadata model.
Dashboard Reporting:
New dashboard is a mandatory tool today in the new edge of the customer as it has to be the clear representation of the business processes to communicate data, demonstrate the ROI and show the DAM strategy alongside organizations goals.
Then you can produce advanced reporting KPI dashboard :
- Keep track of project(s) performance
- Number of projects (breakdowns by region, dept, period, etc.), Number, average, min, max, of approval cycles –Breakdown of rejection reasons
- Project duration (average, min , max)
- Activity Workload (current and projection)
- Identify bottlenecks
- Reduce the time to market
- Continuous Improvement
A good example of B.I integration is the one done by Bynder last year with Sisense :
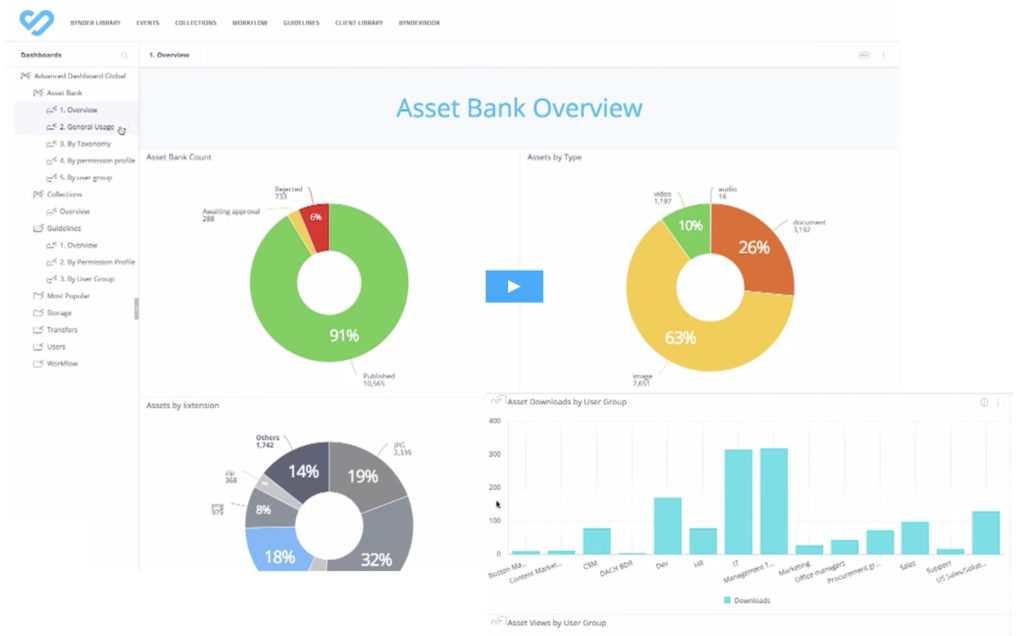
The quality of the report is mainly dependant of the DAM vendor. Most of them are using Elastic Search and Kibana to display the metrics. The user interface is really important again for the adoption by stakeholders, do not miss this point ! A bright, shiny BI visualization is perfect for creating beautiful visual reports when it comes to tackling complex data.The vendor has to deliver default presets for these dashboard even if beyond each customer is a different use case with different custom metadata. Maybe you have to build a data analytics team or asking some services by your DAM vendor.
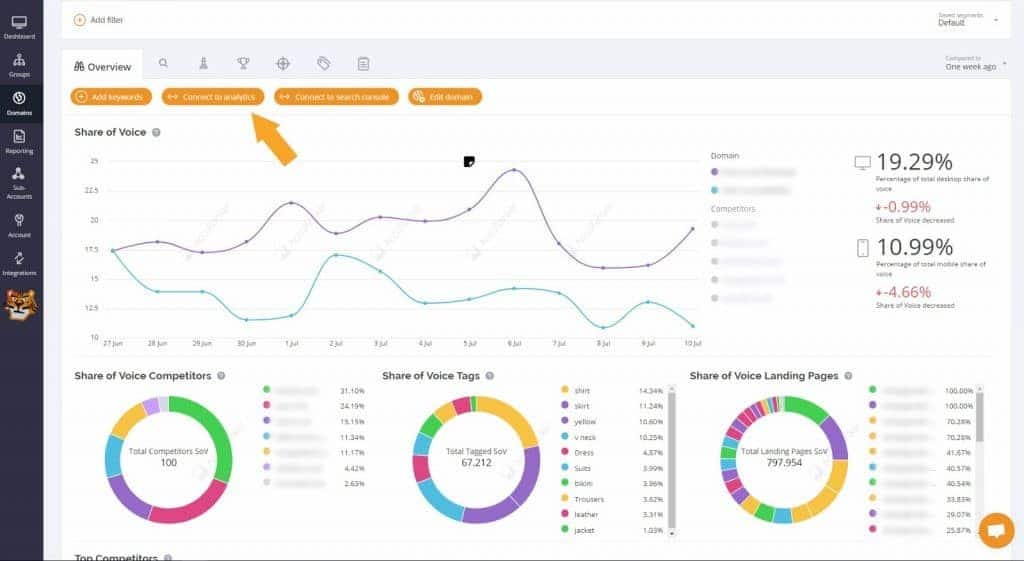
One other good example and leader is Adobe analytics :
AI and machine learning will also bring new capabilities for DAM KPIs able to map closer your business workflow and learn from the usage of each user. In the new multi-cloud environnement of customers you will have to build new data pipelines with different cloud providers and merge them into a cloud-agnostic framework that powers your KPIs with neural interfaces. But building a data-driven business includes choosing the right DAM system and implementing best practices around its use.
As we see a DAM system as the unique source of truth for your organization will require a true engagement with your team alongside your asset life cycle. A successful DAM strategy is based 95% on people and 5% on technology so it is important to educate your team but also the vendor to improve the system with a great user experience improving user adoption and maximizing the ROI.
3 benefits of KPIs with DAM :
- Productiv savings
- Revenue growing
- Increased brand consistency and brand value
Your data is a gold mine and your businesses have become masters at collecting data, reason why it is important to invest in a business intelligence and data analytics solution at the top of your DAM system. When choosing a DAM vendor, you want a recognized industry leader that provides cost-effective, end-to-end BI software that is easy to implement and that offers ready-to-go self-service for users of all skill levels.
For this last article of the year hope it will help you. DAM knowledge is the first step of our blog towards addressing the challenges of customers.
We are there to help you make smarter decisions no matter where you are in your analytics journey or how to select your DAM solution. We can help you understanding the importance of building a business case around it to ensure you get the DAM system your organization needs.
Have some last awesome days in 2019, all the best wishes from our team.
Looking forward working together in 2020 with your DAM, PIM, CMS projects alongside your digital strategy.
Best Regards
Frédéric SANUY
CEO - Activo Consulting